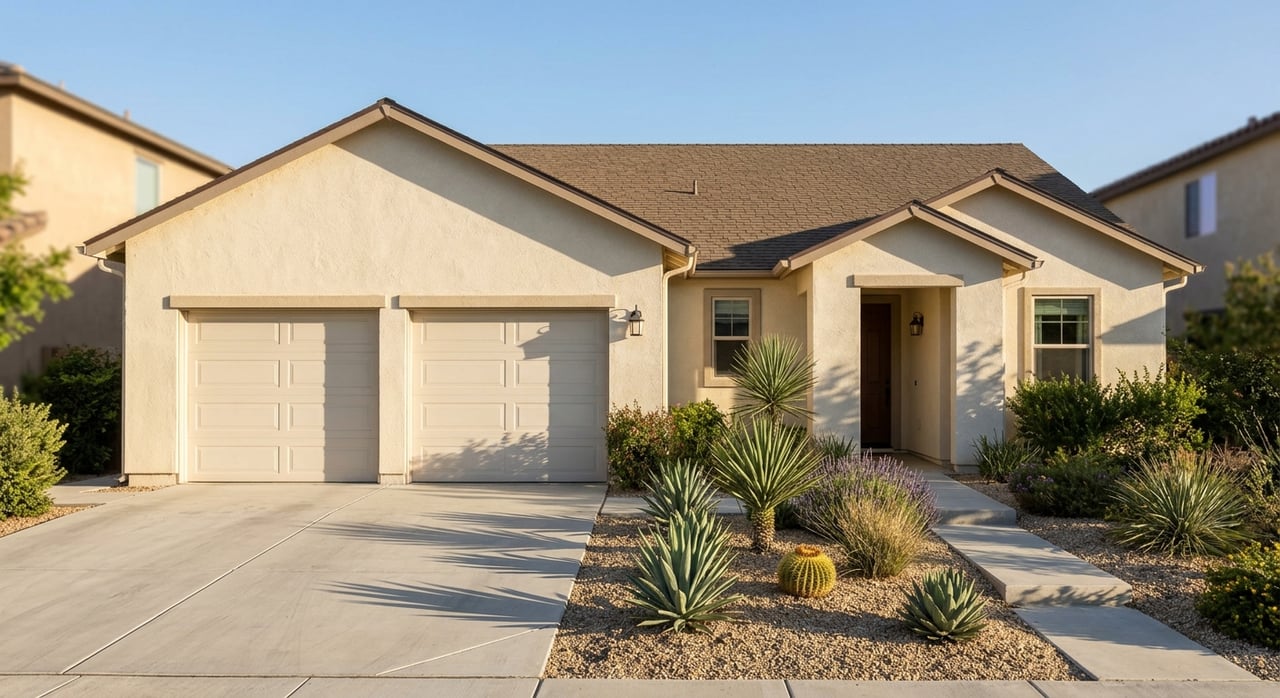
Analyzing Cash Flow In Lancaster Single-Family Rentals
April 16, 2026
April 16, 2026
If you are looking at Lancaster single-family rentals for cash flow, the headline is simple: the numbers can work, but only with disciplined underwriting. Lancaster offers a lower entry price than much of greater Los Angeles, which makes it attractive on first glance. But if your goal is monthly cash flow, you need to look past the median price and rent headlines and study basis, rent comps, and reserves carefully. Let’s dive in.
Lancaster often shows up on investor radar because the market sits at a much lower price point than the broader Los Angeles metro. Census Reporter data shows a median owner-occupied home value of $473,800 in Lancaster versus $908,500 in the Los Angeles-Long Beach-Anaheim metro. That gap is a big reason buyers screen Lancaster as a lower-basis California single-family rental option.
Current pricing also looks relatively steady rather than wildly volatile. Redfin reports a February 2026 median sale price of $455,000 and 46 median days on market, while Zillow shows a similar price band. That consistency matters because it suggests you can underwrite around a realistic purchase range instead of chasing a fast-moving market.
At the same time, this is not a market where you should assume quick appreciation will save a weak deal. Research from Redfin and Zillow shows prices are slightly below year-ago levels. In practical terms, that means your margin for error matters more than your upside story.
For a first-pass view, the citywide numbers are straightforward. The median sale price is roughly $455,000, and Realtor.com’s single-family rental data shows a median monthly rent of $2,672. There were also 151 active homes for rent and an average of 74 days on market.
Those numbers are useful for orientation, but they are not enough to make a buying decision. Zillow’s current 3-bedroom rental listings show asking rents ranging from about $1,900 to $3,500 per month. That spread is wide enough that a citywide median can easily mislead you if the home you are analyzing is not close to the median product.
This is why rent comps matter more than broad averages. A 3-bedroom, 2-bath older home with deferred maintenance should not be underwritten like a better-updated 4-bedroom home in a different pocket of the city. In Lancaster, submarket detail matters.
Using the median sale price of $455,000 and median rent of $2,672, the basic cash-flow picture is tight. At Freddie Mac’s reported 30-year fixed rate of 6.46% on April 2, 2026, a buyer putting 20% down would have a principal and interest payment of about $2,291 per month.
Then you need to add operating costs and reserves. A sample monthly model from the research report includes about $455 for property taxes, $190 for insurance, $212 for management, $133 for maintenance, and $133 for vacancy. That brings total monthly carry to roughly $3,413.
Against median rent of $2,672, that produces an estimated negative cash flow of about $741 per month before capital expenditures and repairs reserve. That is the key takeaway for many buyers: a median-priced Lancaster single-family rental generally does not pencil as a strong cash-flow property on standard leverage at today’s rates.
The median example does not mean every deal is bad. It means you need a tighter buy box. If you are shopping in Lancaster for cash flow, you will likely need one or more of the following:
The same research report estimates an unlevered cap rate of about 4.1% and a break-even gross rent yield of about 9.0% on the median deal. That tells you just how important basis is. If your purchase price is too high, it becomes difficult to make the monthly numbers work.
One of the clearest findings in the research is that not all Lancaster ZIP codes perform the same way. Realtor.com’s February 2026 zip-code data shows this simple rent-to-price spread:
| ZIP code | Median listing price | Median rent | Approx. gross rent yield |
|---|---|---|---|
| 93535 | $430,000 | $2,650 | 7.4% |
| 93534 | $424,210 | $2,500 | 7.1% |
| 93536 | $550,000 | $2,897 | 6.3% |
On a first pass, 93535 and 93534 appear more rent-efficient than 93536. That does not automatically make them better investments, but it does suggest where you may want to spend more time pulling comps and evaluating inventory.
This is where a local, property-by-property review matters. Two homes with similar square footage can perform very differently based on condition, layout, lot utility, and achievable rent. A stronger gross yield area can still produce a weak deal if the home needs too much work or is priced too aggressively.
Lancaster’s rental vacancy picture is relatively supportive, but it is not a reason to skip reserves. Point2Homes estimates a local rental vacancy rate of 4.3%, compared with 7.2% nationally in Q4 2025. That lower figure suggests demand is reasonably healthy.
Still, homes for rent are not leasing overnight across the board. Realtor.com’s data shows an average of 74 days on market for Lancaster single-family rentals. That is a strong reminder that even in a tighter market, turnover costs time and money.
A practical underwriting approach should include a vacancy reserve. The sample model uses 5% of rent, which is a sensible reminder that full occupancy should not be your default assumption.
Another number worth watching is local income. Census Reporter lists Lancaster’s median household income at $87,324. Thirty percent of that works out to about $2,183 per month, which is below the current median single-family rent.
That does not mean homes are unaffordable across the board. It does suggest that the likely renter pool for many single-family homes may include households with above-median income or multiple earners. If you are underwriting rent growth or turnover risk, that is an important part of the demand picture.
Age of housing stock can affect your budget just as much as rent level. Point2Homes data shows Lancaster’s renter-occupied housing is concentrated in older construction, especially homes built in the 1980s, followed by the 1990s and 1970s. Only a small share of renter-occupied units were built in 2010 through 2019.
For you as a buyer, that likely means more homes will need thoughtful budgeting for systems, finishes, and ongoing maintenance. Even if the monthly rent looks attractive, an older roof, HVAC system, plumbing issue, or interior update cycle can quickly reshape the return.
Newer homes do exist, but they trade differently. Redfin’s Eastside new-home page shows 2024 to 2026 built homes priced around $475,000 to $571,384, while Redfin neighborhood pages show meaningful differences between Eastside and Westside pricing. The larger point is this: citywide averages are not enough. You need to compare each home against similar nearby homes, not against Lancaster as a whole.
If you are evaluating a Lancaster rental, state regulations should be part of your diligence. Housing Is Key guidance explains that the Tenant Protection Act caps rent increases on covered units at 5% plus CPI or 10%, whichever is lower. The same guidance notes that properties less than 15 years old may be exempt from the rent cap, and that single-family homes are among the property types identified as exempt from the act’s eviction protections.
The important takeaway is simple: check AB 1482 status for each specific property. Age and property type matter, and you do not want to assume a rule applies without verifying the property’s facts.
If you are serious about buying in Lancaster, a better process can save you from forcing a deal that does not work. Start with the basics and stay conservative.
Do not rely only on citywide median rent. Pull comparable leased or listed homes with similar bedroom count, bathroom count, condition, and location. In this market, that can make a major difference in projected income.
Include property taxes, insurance, management, maintenance, and vacancy at a minimum. If the home is older, give extra thought to future repairs and replacement cycles. A property that barely breaks even on paper can turn negative quickly if your reserves are too light.
Since many median deals do not cash flow with standard debt, your purchase price matters more than almost anything else. Negotiation room may exist because Realtor.com classifies Lancaster as a buyer’s market, but homes are still selling at about 100% of list price on average. That means discounts may be possible, but deep bargains are not guaranteed.
Do not assume all parts of Lancaster behave the same. First-pass yield data suggests 93535 and 93534 may screen better than 93536 for cash flow. From there, drill into the specific pocket, product type, and condition.
Lancaster can still be worth a look if you want a lower-basis California single-family rental, but you should not expect strong cash flow from a median-priced home using standard financing at current rates. The market looks more favorable for investors who buy below median pricing, bring more equity, secure stronger rent comps, or target the more rent-efficient pockets of the city.
If you want help thinking through a Southern California purchase with a practical, numbers-first approach, Kimberly Ybarra offers personalized guidance for buyers, relocations, and investor-minded clients who want clear advice and a high-touch experience.
Stay up to date on the latest real estate trends.
Get assistance in determining current property value, crafting a competitive offer, writing and negotiating a contract, and much more. Contact me today.